Analysis Techniques: Annual Analysis Tutorial
|
Information to get started:
- The lesson below contains step-by-step instructions and "snapshots" of what each step
looks like when carried out in a Microsoft Excel workbook. Blue shading of information
in the Excel illustrations denotes changes made from the previous step. Dots placed in
three consecutive rows indicate that a portion of data is hidden from sight.
- You can download an Excel workbook containing the complete data set by clicking on the
"Download Data" link below. It contains
each calculation step on a separate worksheet. To move between steps, click on the
tabs at the bottom of the excel window.
- When you download the file, it may open in your browser window. You may wish to use the
"save as" function to save the file to a local drive and then reopen it in Excel. This
will make it easier to flip between the online lesson and the example workbook.
- Finally, we want to remind you that the techniques explained on this site are statistically
based; therefore results must be viewed as predictions and not as facts. Please use
the techniques and the information obtained from them responsibly!
|
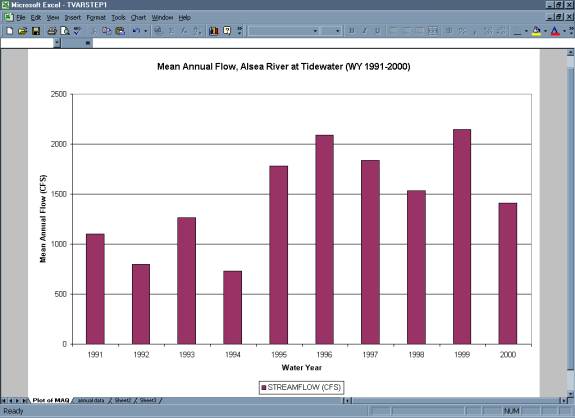
Step 1: Calculating Mean Annual Flow
- You can
use the average function in Excel to obtain the average streamflow for
each water year in the period of record. The averaging will involve 365
or 366 daily values in each water year (366 days accounts for leap year).
See the Data
Manipulation section for
a more detailed explanation of how to obtain data and to calculate mean
annual flow.
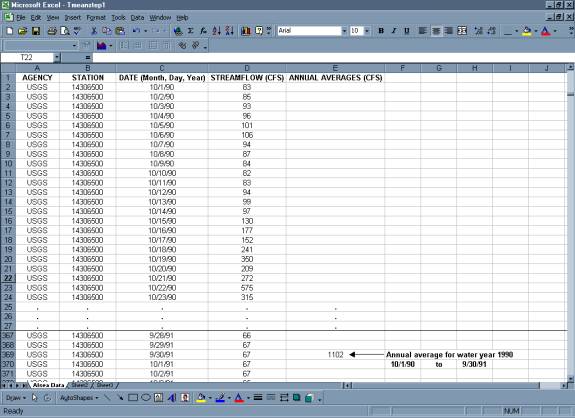
- Copy your mean flow for each year into a new table.
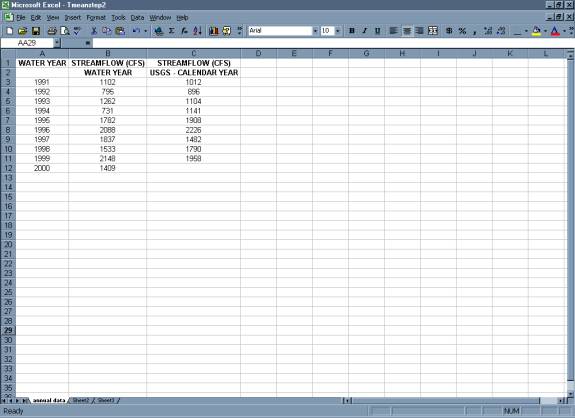
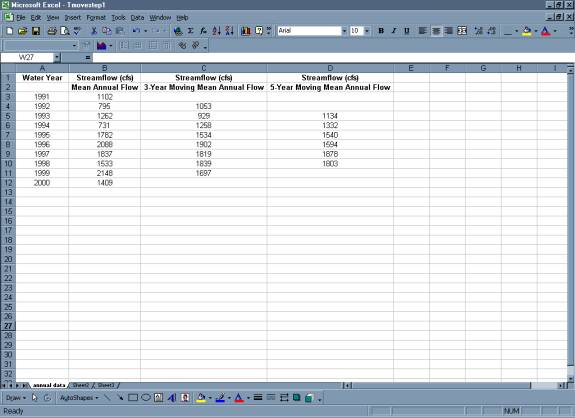
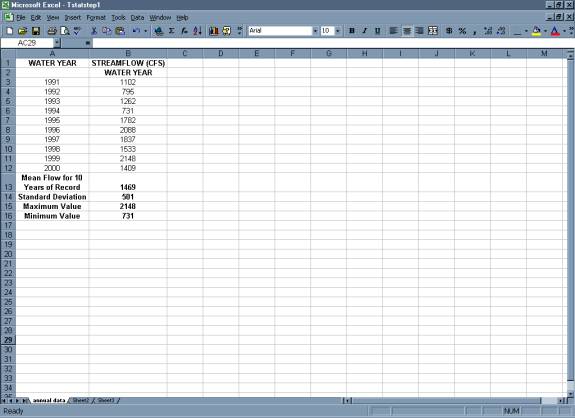
Step 2: Calculating the Mean Annual Flow for Period of
Record
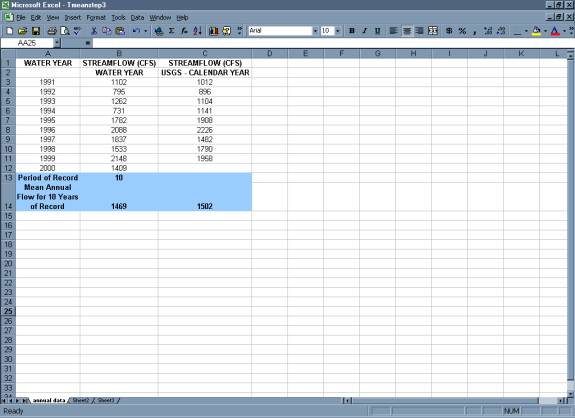
- Use the average
function to calculate the mean annual flow for the period of record. For
this example, the period of record is 10 years.
- Column C in the table below contains the mean annual flow for "calendar
years". It is interesting to compare how the value changes when the mean
is calculated for "calendar years" instead of "water years".
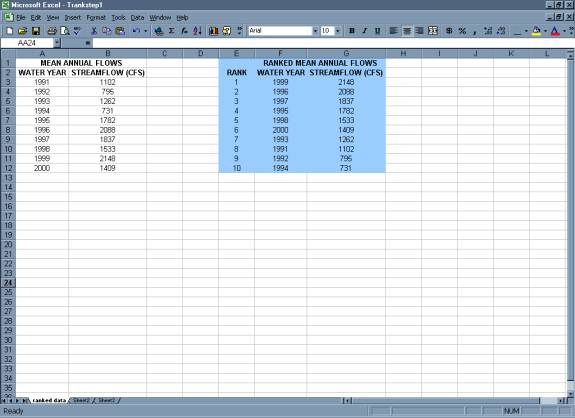
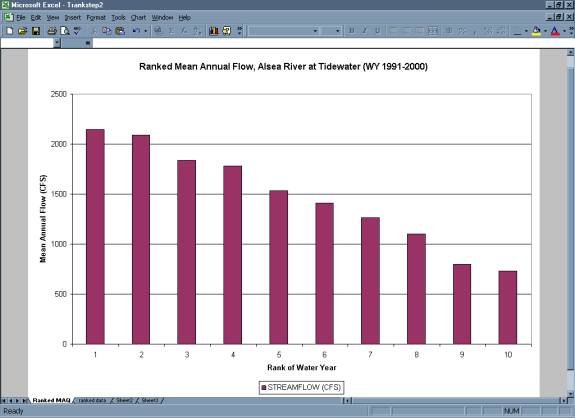
Step 3: Ranked Annual Flow
- Use the sort option (under the Data menu) to sort
mean annual flows in descending order.
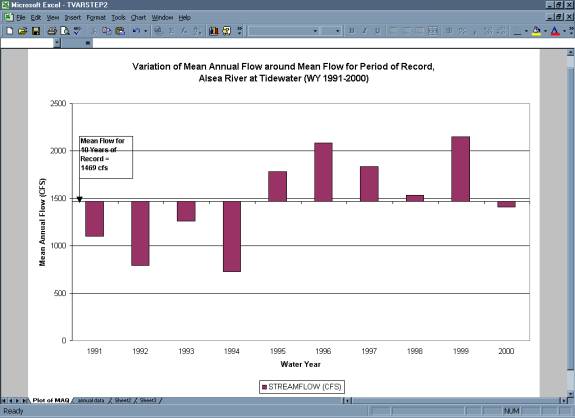
Step 4: Pattern Analysis
Step 4a: Variation of Mean Annual Flow around Mean Flow for Period of
Record
- Plot mean annual flow vs. water year.
- Set
the Y-axis to intersect the X-axis at the value for the mean flow for the
period of record.
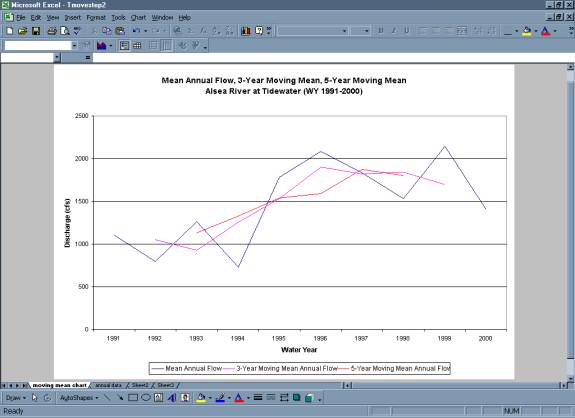
Step 4b: 3-Year and 5-Year Moving Mean
- Starting with the 2nd and 3rd year of the period
of record, use the average function in Excel to calculate the mean annual
flow of the
surrounding 3 (yr 1 to yr 3) and 5 (yr 1 to yr 5) years. Copy these formulas
down the columns to calculate the mean annual flow for 3-year and 5-year
intervals
for the entire period of record. Note that there will be no entry for the
last year in the record for the 3-year moving mean and no entry for the
last two years in the record for the 5-year moving mean.
- Plot the Average mean annual flow, the 3-year moving mean annual flow, and the
5-year moving mean annual flow.
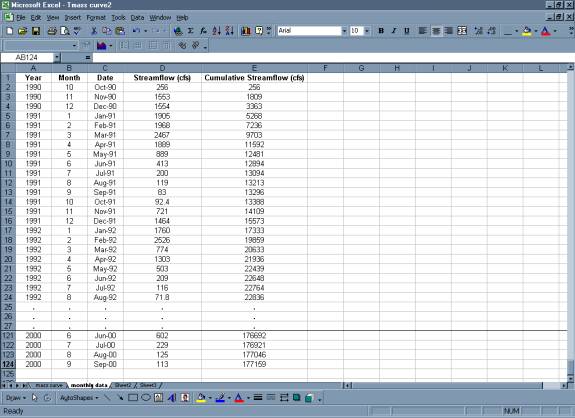
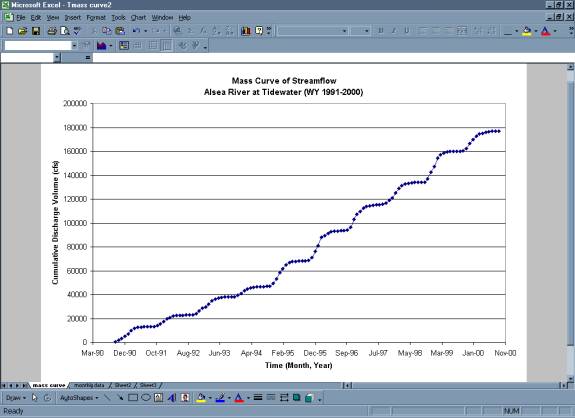
Step 4c: Mass Curve Method
- Calculate
cumulative quantity of streamflow for the period of record using average
monthly flows. See the Data Manipulation section for a more detailed
explanation of how to calculate average monthly flows.
- Plot
cumulative streamflow versus time.
Step 5: Calculate Simple Statistics
- Excel
functions can be used to perform these calculations.
- Mean -- use the AVERAGE function.
- Standard Deviation -- use the STDEV function.
- Maximum Value -- use the MAX function.
- Minimum Value -- use the MIN function.
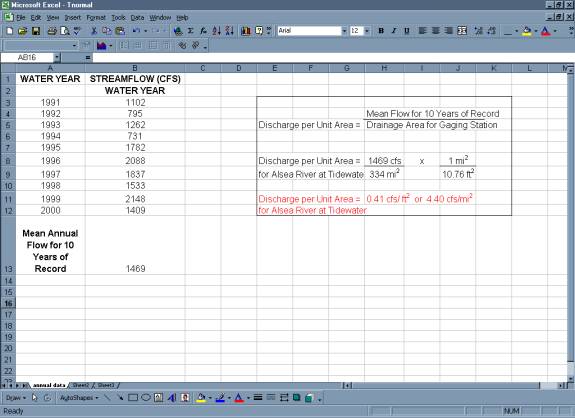
Step 6: Normalization of Mean Annual Flow (Discharge per
Unit Area)
- Calculate
Discharge Per Unit Area.
- To do this, you need
the Station Description provided by the USGS web page. It includes
the drainage area for the gage.
Show
Me (this will open in a separate browser window)
- Mean
flow for the Period of Record is divided by the Drainage Area for the gage.
|