| |
 |
|
Tips for Data ManipulationThis section of the website covers the following topics:
You can also view and print this webpage as a pdf file. Obtaining Streamflow Data for Gaged SitesFormat of Available Data:The main sources for streamflow data are the US Geological Survey (US Department of Interior) and state water resources departments (e.g. the Oregon Water Resources Department). The Hydro Data Links page contains links to hydrologic data on these websites and to other data sources. The summary values that are most readily available to the public from these sources are the mean daily discharges (the average flow during each consecutive 24-hour period) for the period of days, months, or years of interest. The USGS web site lists the year, month, date, and discharge (usually in cfs) for the period of record. Calculation of Monthly and Annual Values:It is often necessary to calculate the monthly and annual data from the daily values. The following are some tips for calculating monthly and annual values:
(What is the difference between Tutorial and Example files? Click here for an explanation...) Obtaining Streamflow Data for Ungaged SitesProject sites are usually located on small or moderate-size streams that do not have operating stream gages. Locating streamflow data applicable to these sites for the purpose of making hydrologic analyses can be difficult. Generally there are two options for finding appropriate data: 1. Use streamflow values from a nearby gaged site that has the same drainage area size. 2. Scale down the streamflow values from a gage on a larger nearby watershed to the size of the drainage area of the project stream. Using streamflow values from a gaged site of the same size:
When using a different stream to estimate streamflow values for a project site, it is important to consider the following:
The more components that are similar between the two basins, the more likely it is that the streamflow values from the gaged site will accurately depict the streamflow characteristics of the project site. Sometimes it may be necessary to look for gaged sites in other states with similar conditions (Washington, California) to find an appropriate site. Scaling down streamflow values for a large watershed:The project site may be located on a small part of a larger basin or the only gaged stream with similar topographic characteristics may have a large drainage area. For example, the project site may be on a small creek that is a tributary to a large river. The large river may be gaged near its mouth where the drainage area is quite large.
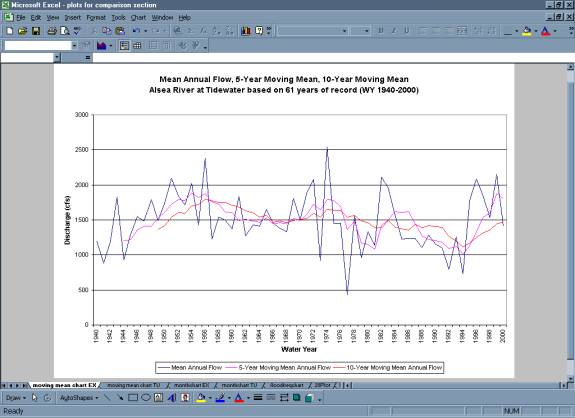
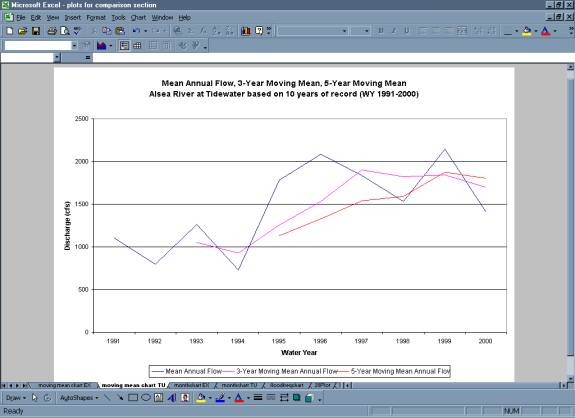
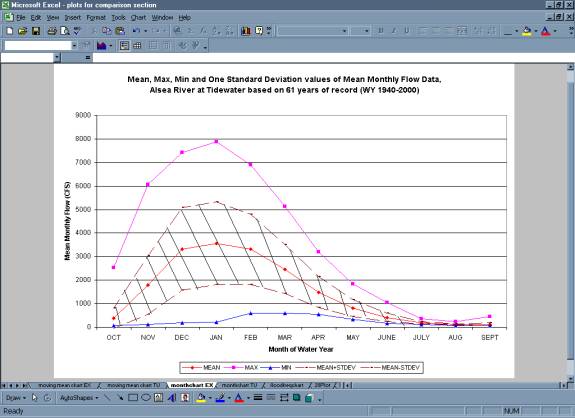
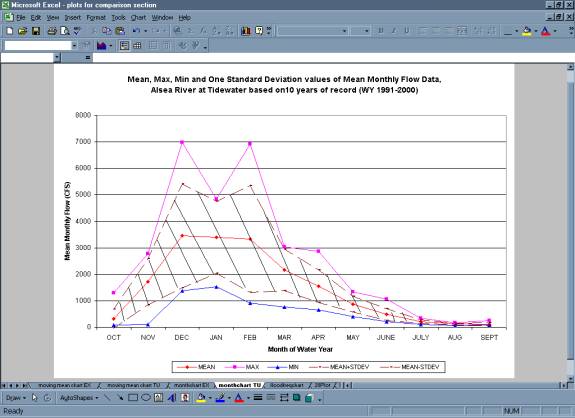
The size of a watershed affects the hydrologic characteristics of that drainage area. A small watershed responds to storms very differently from a large basin. Most of the precipitation on a small watershed tends to run off quickly because there is little time or area for infiltration. On a large basin, travel distances are much longer, channel storage may diminish flow peaks, precipitation has more time to infiltrate, and runoff reaches the basin outlet more slowly after peak rainfall than in a small watershed, such that the discharge per unit area is usually smaller. It is advisable to keep in mind that streamflow values from a large basin may not accurately represent the hydrologic characteristics of a smaller watershed for the reasons given. The Example Applications presented in this web site are all located on ungaged coastal streams. The techniques described above were used to obtain streamflow data used in the analysis. Importance of Length of Period of Record when Selecting a Gaged SiteWhile drainage area and topographic characteristics are important factors to address when selecting a gaged site to represent an ungaged project stream, the length of the period of record should also be considered. It is the nature of statistical analysis that a larger data set will produce more representative results. The longer the period of record, the more likely it is that the streamflow statistics generated will be representative of the long-term flow pattern of the stream in question. For example, values such as the mean flow for period of record and mean monthly flows estimated using 61 years of data (Alsea example analysis) will allow more confidence than values estimated using 10 years of data (Alsea tutorial analysis). When using a shorter period of record, it is more likely that flow values of interest may be overestimated or underestimated, which may lead to errors in determination of design flows. Also, discharge patterns are more easily discerned using a longer data set (see the following four figures). The shorter period of record shows the annual and monthly patterns to be more erratic than does the longer period of record. Thus, it is advisable to search for the longest period of record possible that also meets the other criteria listed in the previous section. Annual and Monthly Analysis
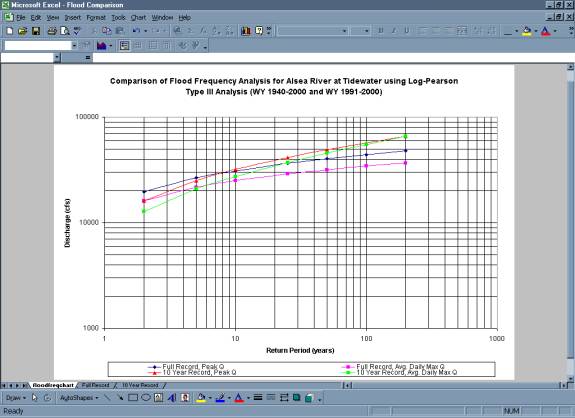
Flood Frequency AnalysisUsing Instantaneous Peak Discharge values versus Average Daily Maximum Discharge values for Flood Frequency Calculations
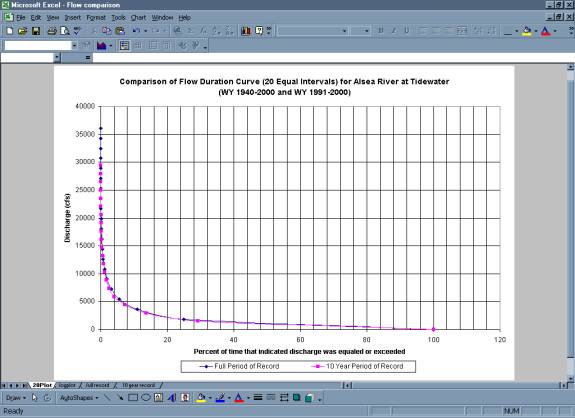
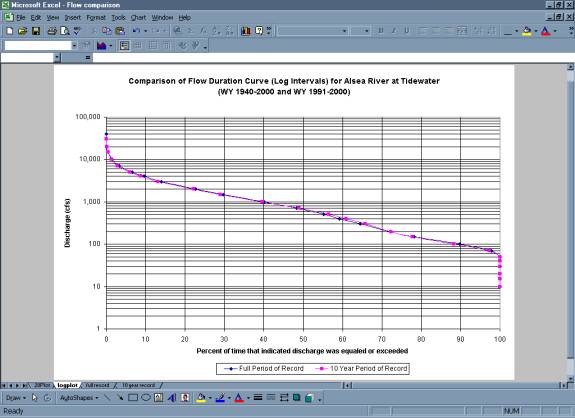
The length of the period of record is also important for flood frequency analysis, as shown by the Comparison of Flood Frequency Analysis plot. The graph shows flood frequency analysis performed using instantaneous peak flow values and average daily maximum values for both the 61-year period of record and the shorter 10-year period of record. In general, the use of average daily maximum discharge values instead of peak flow values in a flood frequency analysis is likely to result in underestimation of the flows associated with various return periods. This is because the daily data used to perform the flood frequency analysis are averaged over a 24-hour period and as such have smoothed out the extreme values. The instantaneous peak data are the largest values recorded at that moment and hence will provide larger values for flood discharges. When performing flood frequency analysis, instantaneous peak flow values should be used to determine design discharges. If peak values are not available, maximum mean daily discharges may be used (with caution). The graph also shows a discrepancy between the flow predictions based on the 61-year period of record and the 10-year period of record. The shorter period of record underestimates the flood discharge values for the smaller return periods and overestimates the flood discharge values for the larger return periods. If a structure were designed for the 100-year flood using the smaller data set, it would be over designed and may cost more than using the 100-year discharge based on the 61-year period of record. Flow Duration AnalysisBy viewing the Comparison of Flow Duration Curves graphs, the general shape of the flow duration curves does not seem to vary significantly between the 61-year period of record and the 10-year period of record. However, on a log scale, even small changes on the graph may indicate significant differences in discharge values. When generating flow duration curves, one must choose a method for separating the data into intervals or classes. If the data is separated into an equal number of intervals, often the majority of flows will fall into the first few classes. The lower end of the flow duration curve is difficult to read. This problem can be avoided by separating the data into log intervals. The log intervals allow the data to be stretched out making it easier to read the flow duration curve at all points. (Note: The processing capabilities of modern computers makes it easy to generate flow duration curves using all individual daily values, so class limits are no longer as critical a consideration as they were a few years ago.)
Building confidence in flow estimates. How good are the results of the analysis?It may not always be possible to find a nearby gage that meets all of the appropriate criteria. It may be necessary to use a gage that has a short period of record or is in a slightly different geographic region. In these situations, the user may question if the analysis results are representative of the long-term conditions of the stream in question. One method that can be used to build confidence in the results is to compare the data from the gage used for analysis with a gage in the project region that has a long period of record. The mean annual flows normalized to drainage area can be used for comparison.
Consider the following questions:
The data for the gage used for analysis can be scaled to the long-term data using a ratio of the average MAQ/DA values for both gages. However, it is important to consider all of the criteria listed in the Ungaged Sites section before scaling values.
|
|
| This website was developed by Oregon State University's Civil, Construction, and Environmental Engineering Department with support from the state water institutes program of the U.S. Geological Survey. | |
| Copyright © 2002-2005 Oregon State University -
Web Disclaimer Web Address: http://water.oregonstate.edu/streamflow/ Send Comments to: Peter Klingeman |