| |
 |
|||||||||||||||||||||||||||||||||||||||||||||||||||||||||||||||||||||||||||||||||||||||||||||||||
Examples: Power Generation at the Chetco RiverLocation: The North Fork of the Chetco River is located in the South Coast Basin. It has its headwaters in the Coastal mountains near Bosley Butte at an elevation of approximately 1,000 feet above sea level. It flows south to join the main stem of the Chetco River, which flows into the Pacific Ocean at Brookings. Description of Project: Suppose that an entity would like to determine if a small power generation facility could be placed on the North Fork of the Chetco River. For illustration purposes, power generation calculations will be made for two different scenarios. The first scenario for the low-head hydro project will be a turbine capable of passing a small design discharge. The second scenario will be a power generation plant with the capacity to handle a design discharge that is equaled or exceeded 50% of the time. It would be useful to determine the percent of time that full power generation could be expected for both scenarios and also what percent of the time partial energy generation would occur. Finally, the user would need to identify the critical months (months of the year that may not have enough flow to satisfy the power requirements). Objectives: Assess the power generation capability of this stream. Determine the quantity of power that can be generated. Determine the percentage of time full power can be generated and percent of time partial power can be generated, as well as the amounts of energy produced. Generate flow duration curves to determine flows and the percent of time these flows are equaled or exceeded. Perform monthly analysis to determine which months will provide full power production and which months are considered the critical months. Procedure: Step 1: Review the preliminary estimates page to determine a rough estimate of streamflow values for this region.The preliminary estimates for the South Coast Basin will appear as follows:
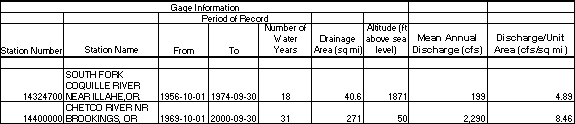
Note that the percentages do not quite add to100% (sum is 103%) due to rounding of decimal values. Step 2: Determine the drainage area of the North Fork of the Chetco River from topographic maps (USGS topographic map, Gold Beach).After delineating the watershed boundary of the North Fork of the Chetco River on a topographic map, the drainage area was estimated using graph paper. The drainage area for the North Fork of the Chetco River is approximately 40 square miles. Drainage area could also be determined using a GIS. With this drainage area the annual discharge is expected to be approximately 202 cfs. The annual flow pattern shows low flows during the summer months and high flows during the winter months. December, January and February have the highest flows. Step 3: Find appropriate stream gage records.A review of the table of USGS gages for coastal Oregon shows two existing gages that may be used for this project: one on the South Fork of the Coquille River and one on the main stem of the Chetco River. The table below lists information for these gages. The gage on the South Fork of the Coquille River has a drainage area that is similar to the project stream. The Chetco River gage has a longer period of record but has a large drainage area compared to the project stream. Hydrologic analyses necessary for power generation calculations can be done using both gages.
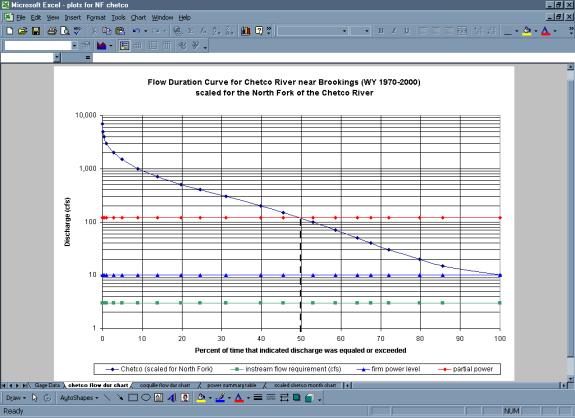
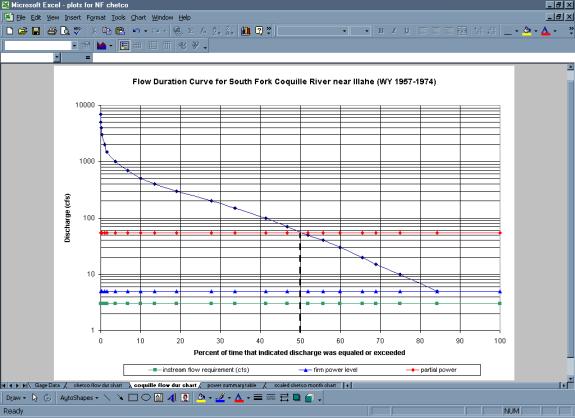
Step 4: Perform a flow duration analysis to determine the percentage of time various flows are expected to occur in a typical year.Assume that there is an instream flow requirement of 3 cfs on the North Fork of the Chetco River at the proposed site. Firm power is defined as the amount of power that is available 100% of the time. In order for a stream to provide full power, it must support both the instream water right and the discharge required for power generation. The streamflow data for the main stem of the Chetco River must be scaled down to adjust for the smaller drainage area of the North Fork of the Chetco River. Streamflow values can be scaled using the ratio of drainage areas (40 sq mi/271 sq mi). The following plots of flow duration curves for both the main stem of the Chetco River (scaled to the North Fork of the Chetco River) and the South Fork of the Coquille River show that the South Fork of the Coquille River has lower exceedence probabilities associated with various discharges. For Example, a discharge of 100 cfs is equaled or exceeded approximately 41% of the time according to the South Fork of the Coquille River data and 53% of the time according to the main stem of the Chetco River data.
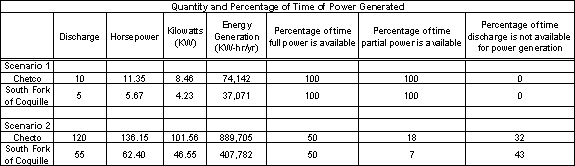
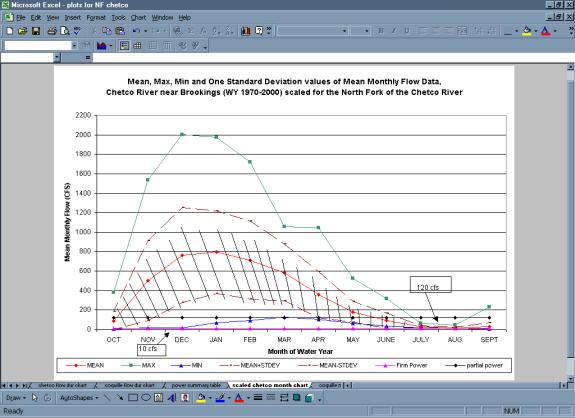
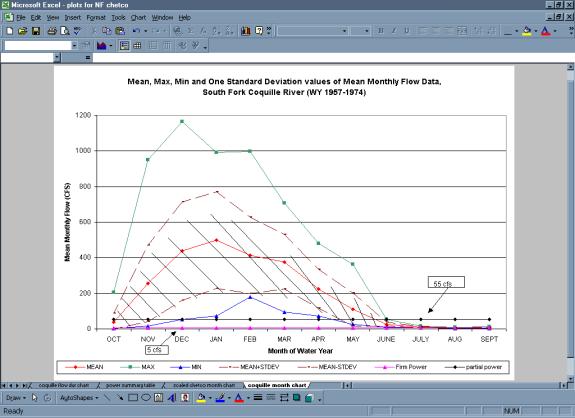
In order to calculate the percentage of time power can be generated, a plot showing the flow duration curve for each stream, the assumed instream flow right for the North Fork of the Chetco River and the discharge used for each scenario was created. The discharge associated with scenario one is the discharge that is equaled or exceeded 100% (firm power level) of the time. The discharge associated with scenario two is the discharge that is equaled or exceeded 50% of the time. The hatched line on the flow duration charts for the Chetco River and the South Fork of the Coquille River indicates the point of full power generation for the second scenario. The percentage of partial power generation is equal to the area under the curve to the right of the hatched line and above the instream flow requirement. The percentage of time discharge is not sufficient for power generation is equal to 100% minus the percent of time full power generation is available plus the percent of time partial power generation is available (100% - (%full power + %partial power)). The results calculated using the data for the Chetco River and the South Fork of the Coquille River offer a range of values that could be used for the design process. For example, the discharge that is equaled or exceeded 100% of the time based on the data for the Chetco River scaled to the North Fork of the Chetco River is 10 cfs. If this value is used for the design process for scenario one, a turbine capable of passing up to 7 cfs could be used for firm power generation. If the results based on data for the South Fork of the Coquille River were used, a discharge of 5 cfs would have to be used for the design process. A turbine capable of passing up to 2 cfs could be used for firm power generation. For scenario two, the discharge that would be equaled or exceeded 50% of the time is 120 cfs based on the results generated using the Chetco River data and 55 cfs based on the results generated using the South Fork of the Coquille River data. The capacity of a power generation plant would be based on these discharge values. Power and energy calculations for each scenario for both streams are shown in the table below. Because they are the more conservative of the discharge estimates calculated using the data for these two streams, results based on the Coquille streamflow data could be used for the design process.
Power = Discharge * Specific Weight of Water * Head (P = gQH) (lbf-ft/s or HP or KW) Energy = Power * Time Interval (KW-hr) Assume a Head of 10ft 550 lbf-ft/s = 1 HP Step 5: Perform Monthly Analysis on the Chetco RiverDischarge vs. Month of the Water Year with various statistics added (such as the mean, the observed extremes and the standard deviation) helps discern the range of flow values to be considered. This analysis allows one to visualize the range of flows expected to occur and the range for some percent (e.g. 68%) of the time to better know the most common flows. As illustrated by the following two charts, the critical months for each scenario for both the South Fork of the Coquille River and the Chetco River are June, July, August, September, and October (the dry period). It seems that all of the months will be able to provide the discharge necessary for the first scenario but that June, July, August, September and October may not be able to provide enough flow for the second scenario.
|
|||||||||||||||||||||||||||||||||||||||||||||||||||||||||||||||||||||||||||||||||||||||||||||||||
|
Home | Navigation
Tips | Preliminary
Estimations | Data
Manipulation | Analysis
Techniques |
| This website was developed by Oregon State University's Civil, Construction, and Environmental Engineering Department with support from the state water institutes program of the U.S. Geological Survey. | |
| Copyright © 2002-2005 Oregon State University -
Web Disclaimer Web Address: http://water.oregonstate.edu/streamflow/ Send Comments to: Peter Klingeman |