| |
 |
||||||||||||||||||||||||||||||||||||||||||||||||||||||||||||
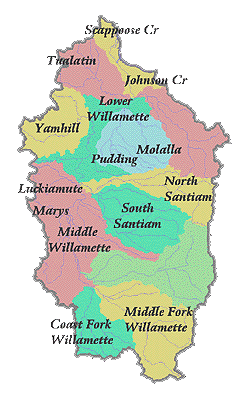
Preliminary Estimations: Willamette
*Note: Values for monthly flow as a percentage of annual flow do not add up to 100% due to overlapping of drainage areas (i.e., nesting) of some or all gages used to calculate the percentages. Go Back to Preliminary Estimations Map
| ||||||||||||||||||||||||||||||||||||||||||||||||||||||||||||
|
Home | Navigation
Tips | Preliminary
Estimations | Data
Manipulation | Analysis
Techniques |
| This website was developed by Oregon State University's Civil, Construction, and Environmental Engineering Department with support from the state water institutes program of the U.S. Geological Survey. | |
| Copyright © 2002-2005 Oregon State University -
Web Disclaimer Web Address: http://water.oregonstate.edu/streamflow/ Send Comments to: Peter Klingeman |