Analysis Techniques: Monthly Analysis Tutorial
|
Information to get started:
- The lesson below contains step-by-step instructions and "snapshots" of what each step
looks like when carried out in a Microsoft Excel workbook. Blue shading of information
in the Excel illustrations denotes changes made from the previous step. Dots placed in
three consecutive rows indicate that a portion of data is hidden from sight.
- You can download an Excel workbook containing the complete data set by clicking on the
"Download Data" link below. It contains
each calculation step on a separate worksheet. To move between steps, click on the
tabs at the bottom of the excel window.
- When you download the file, it may open in your browser window. You may wish to use the
"save as" function to save the file to a local drive and then reopen it in Excel. This
will make it easier to flip between the online lesson and the example workbook.
- Finally, we want to remind you that the techniques explained on this site are statistically
based; therefore results must be viewed as predictions and not as facts. Please use
the techniques and the information obtained from them responsibly!
|
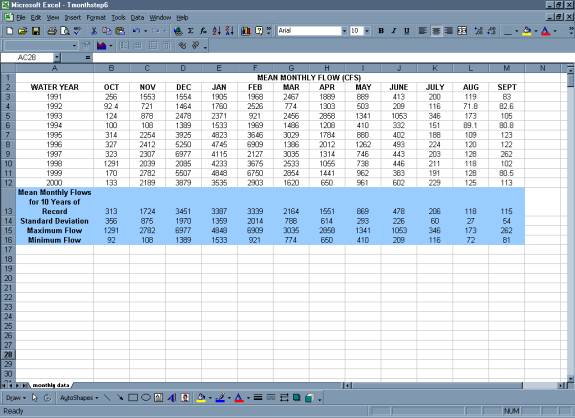
Step 1: Calculate Mean
Monthly Flow for Period of Record
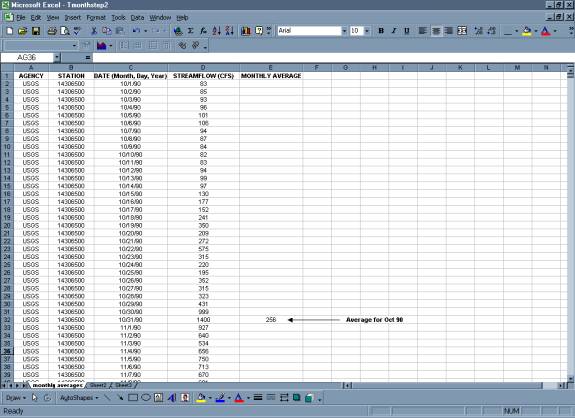
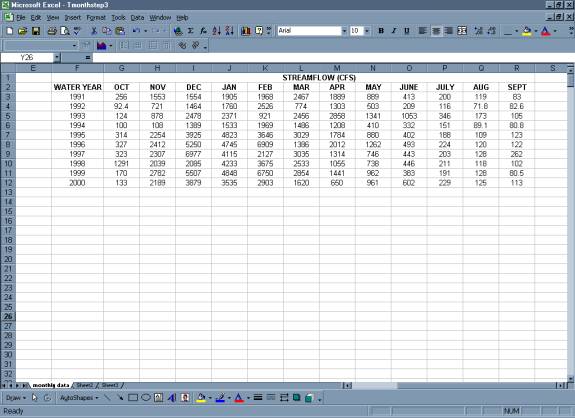
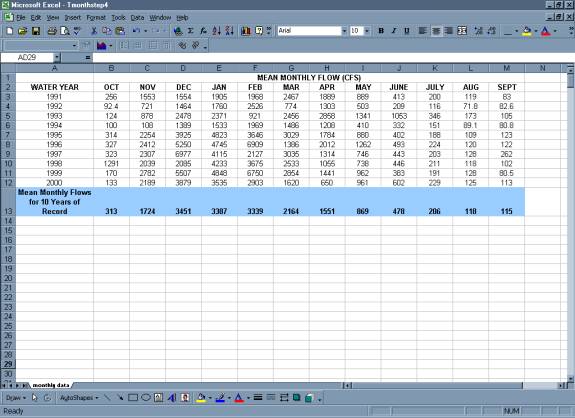
- Calculate
Mean Monthly Flow for Period of Record
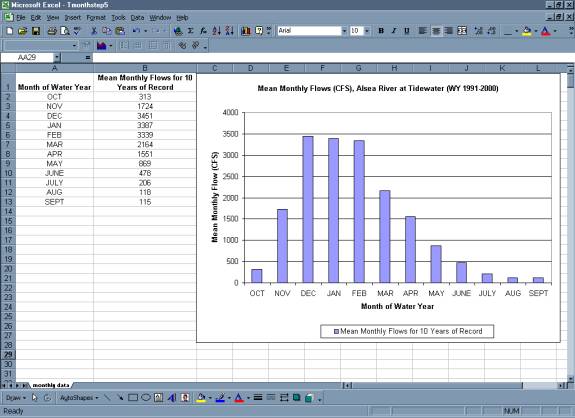
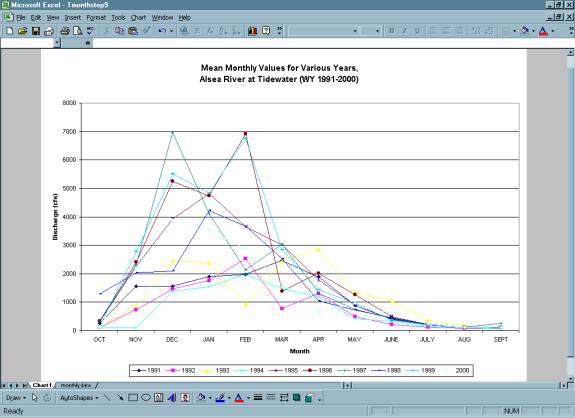
- Plot
Mean Monthly Flow vs. Month
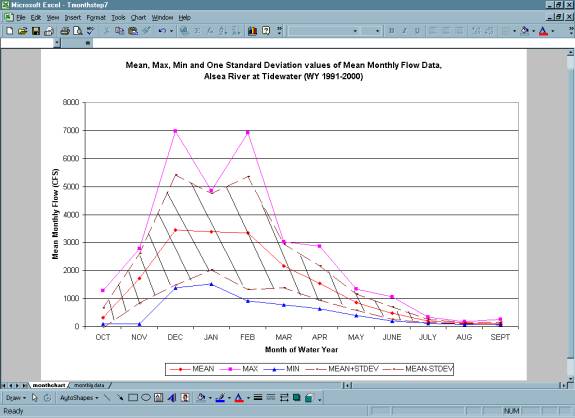
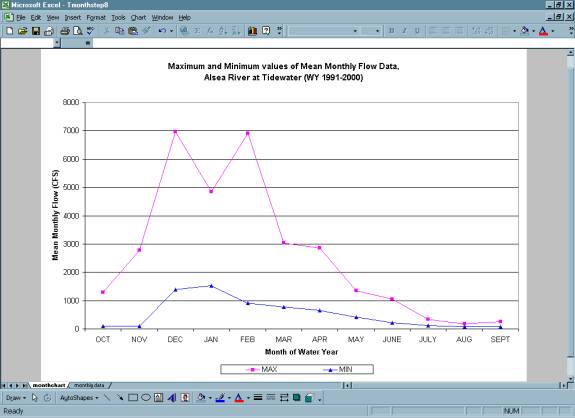
Step 2: Calculate the Simple
Statistics on Monthly Data
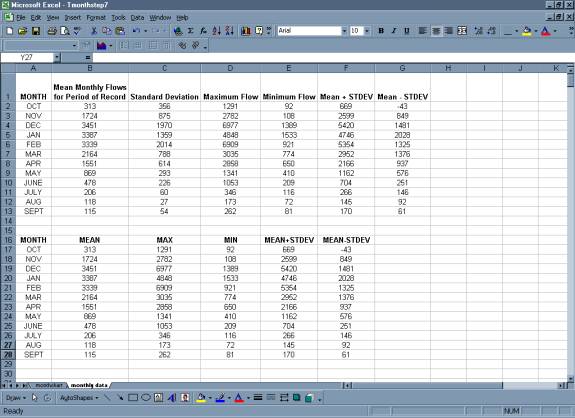
- Various
Plots of Monthly Data with Simple Statistics Included
Step 3: Normalize Monthly
Data
(Mean Monthly Flow as Ratio and Percentage
of Annual Flow)
- Calculate
and Plot Mean Monthly Flows as ratio and percentage of Mean Annual Flow for
Period of Record
|