Analysis Techniques: Monthly Analysis Example
|
Information to get started:
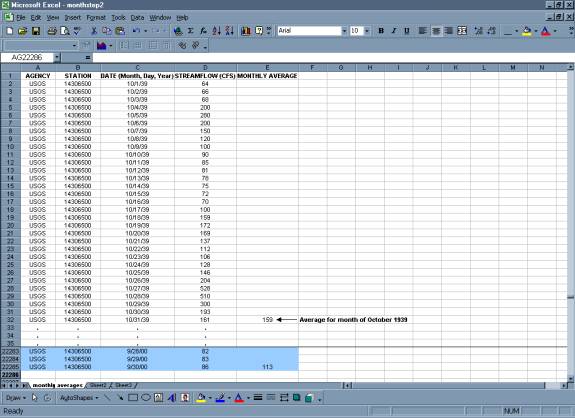
- The lesson below contains step-by-step instructions and "snapshots" of what each step
looks like when carried out in a Microsoft Excel workbook. Blue shading of information
in the Excel illustrations denotes changes made from the previous step. Dots placed in
three consecutive rows indicate that a portion of data is hidden from sight.
- You can download an Excel workbook containing the complete data set by clicking on the
"Download Data" link below. It contains
each calculation step on a separate worksheet. To move between steps, click on the
tabs at the bottom of the excel window.
- When you download the file, it may open in your browser window. You may wish to use the
"save as" function to save the file to a local drive and then reopen it in Excel. This
will make it easier to flip between the online lesson and the example workbook.
- Finally, we want to remind you that the techniques explained on this site are statistically
based; therefore results must be viewed as predictions and not as facts. Please use
the techniques and the information obtained from them responsibly!
|
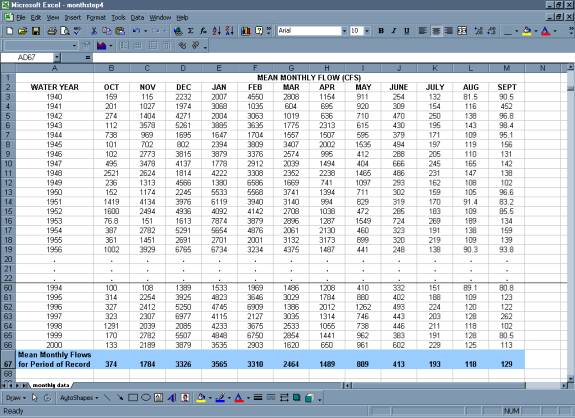
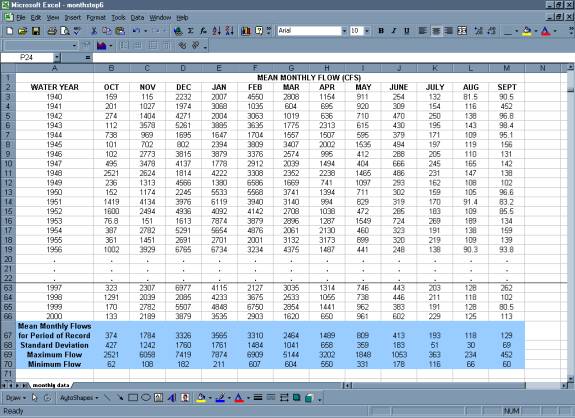
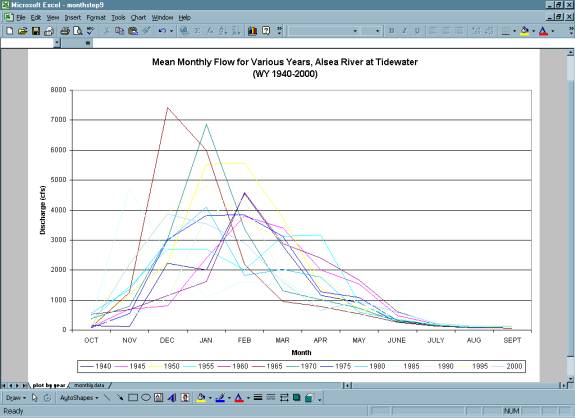
Step 1: Calculate Mean Monthly Flow for Period of Record
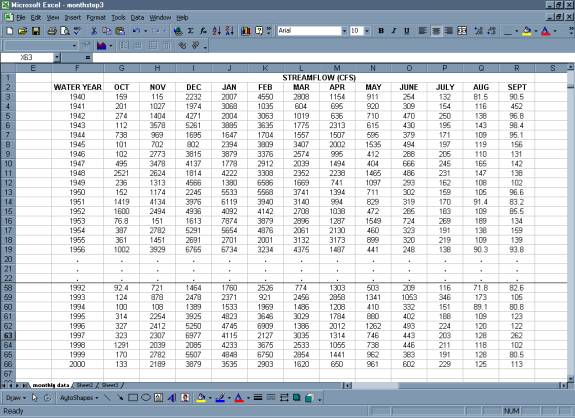
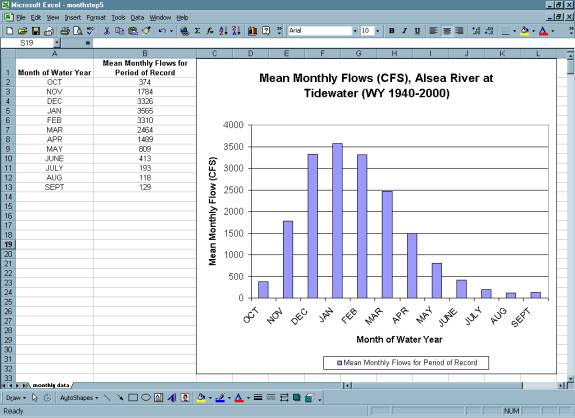
- Calculate Mean Monthly Flow for Period of Record
- Plot Mean Monthly Flow vs. Month
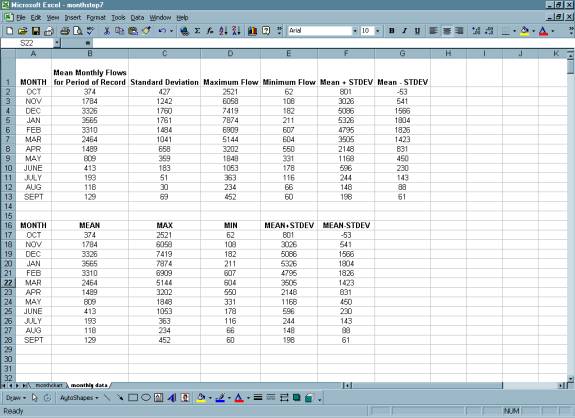
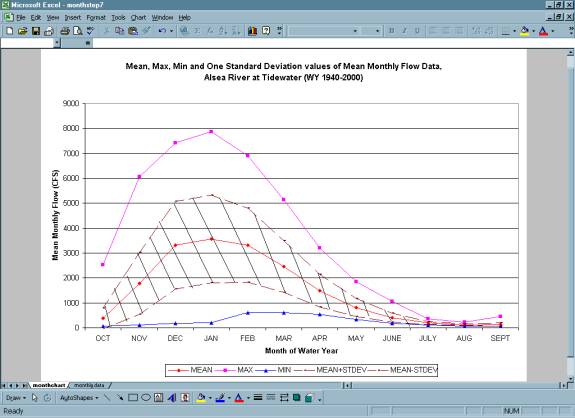
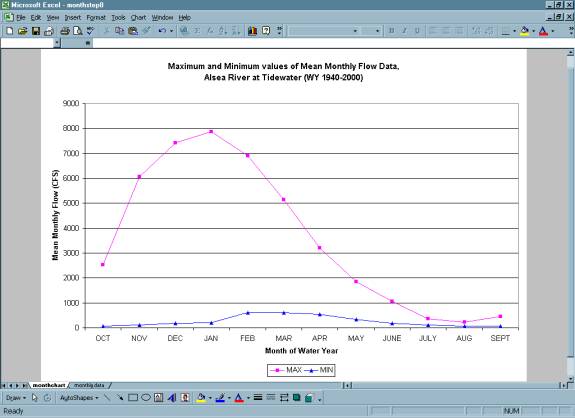
Step 2: Calculate the Simple Statistics on Monthly Data
- Various Plots of Monthly Data with Simple Statistics Included
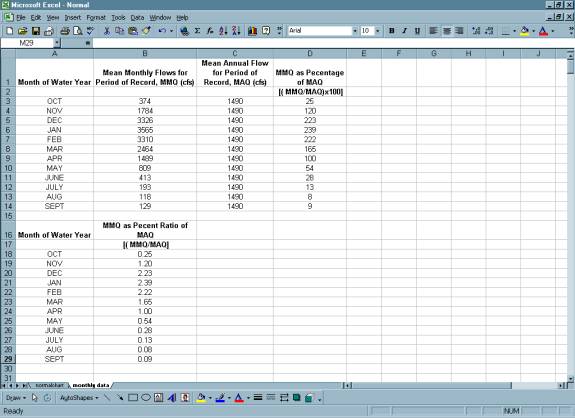
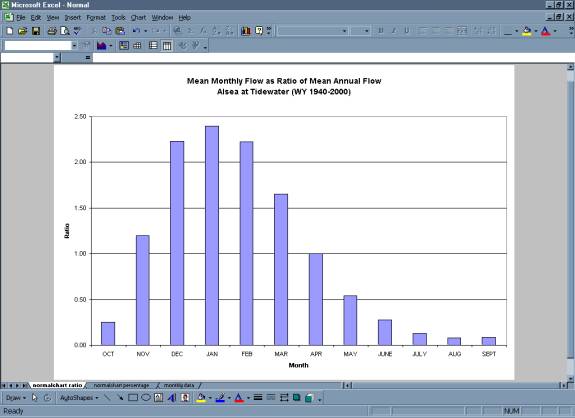
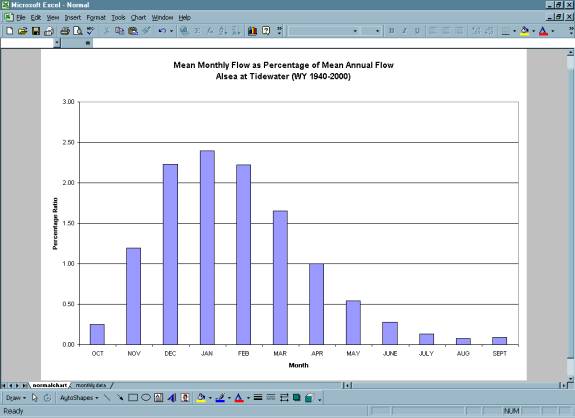
Step 3: Normalize Monthly Data
(Mean Monthly Flow as Ratio and Percentage of Annual Flow)
Calculate and Plot Mean Monthly Flows as ratio and percentage of Mean Annual Flow for
Period of Record
|