Analysis Techniques: Flood Analysis Example with Daily Data (Log-Perason Type III Distribution)
|
Information to get started:
- The lesson below contains step-by-step instructions and "snapshots" of what each step
looks like when carried out in a Microsoft Excel workbook. Blue shading of information
in the Excel illustrations denotes changes made from the previous step. Dots placed in
three consecutive rows indicate that a portion of data is hidden from sight.
- You can download an Excel workbook containing the complete data set by clicking on the
"Download Data" link below. It contains
each calculation step on a separate worksheet. To move between steps, click on the
tabs at the bottom of the excel window.
- When you download the file, it may open in your browser window. You may wish to use the
"save as" function to save the file to a local drive and then reopen it in Excel. This
will make it easier to flip between the online lesson and the example workbook.
- Finally, we want to remind you that the techniques explained on this site are statistically
based; therefore results must be viewed as predictions and not as facts. Please use
the techniques and the information obtained from them responsibly!
|
Step 1: Obtain streamflow data
- Obtain daily streamflow data from the USGS web site.
- Go to http://oregon.usgs.gov
- Select Historical Water Data
- Select Surface Water
- Select Daily Data
- Check box under Site Identifier for Site Name and
Submit
- Type in Alsea under Site Name and select match any part
and Submit
- Select gage at TIDEWATER (140306500)
- Select Tab-separated data
- Copy entire data set into Excel worksheet
- Paste special as text (this will separate the data into
columns)
- Calculate the maximum discharge for each water year in the
period of record.
- The AVERAGE, MAX, and MIN functions in excel can be used to calculate
these values for each water year. It may be more efficient to calculate
the mean, maximum, and minimum flows for each water year in the period
of record at one time.
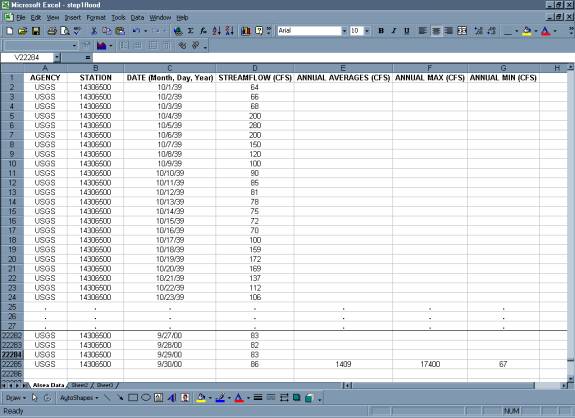
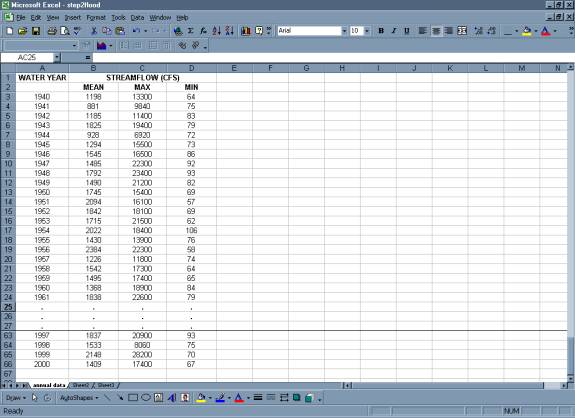
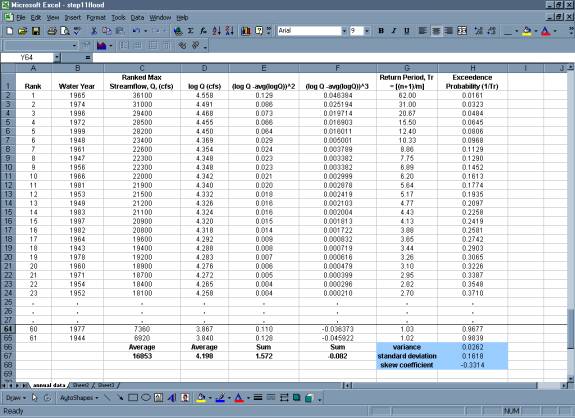
Step 2: Organize the information
in a table.
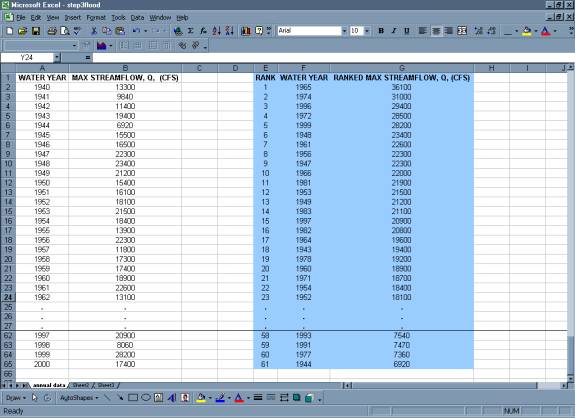
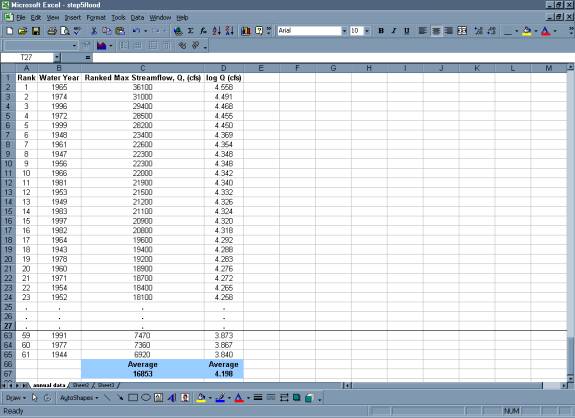
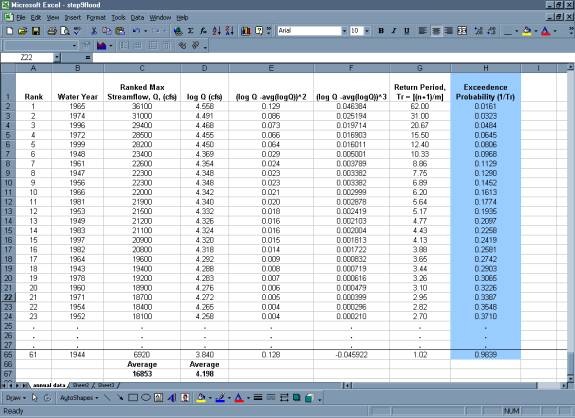
Step 3: Rank the data from
largest discharge to smallest discharge.
- Add a column for Rank
and number each streamflow value from 1 to n (the total number of values
in your dataset).
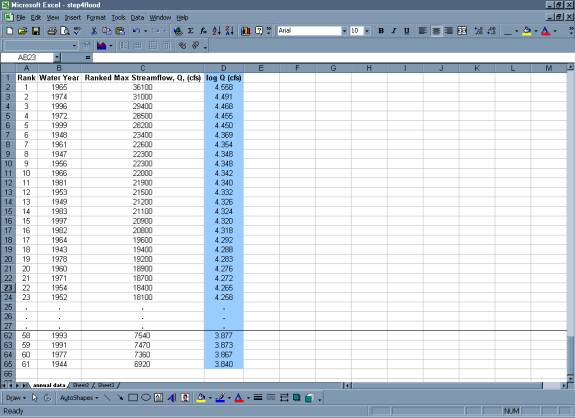
Step 4: Create a column
with the log of each max or peak streamflow using the Excel formula {log
(Q)} and copy command.
Step 5: Calculate the Average
Max Q or Peak Q and the Average of the log (Q)
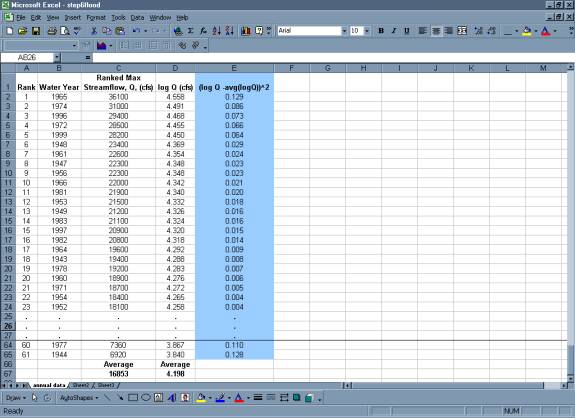
Step 6: Create a column with the excel formula
{(log Q avg(logQ))^2}
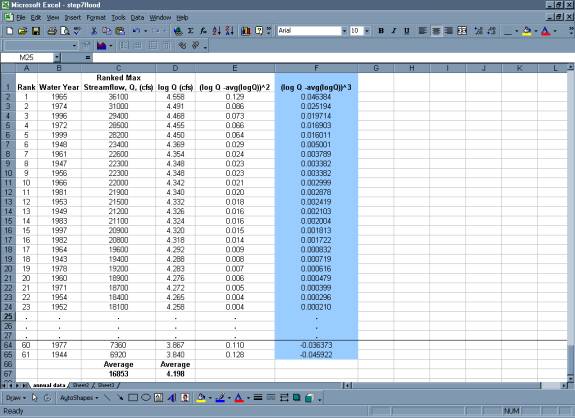
Step 7: Create a column
with the excel formula {(log Q avg(logQ))^3
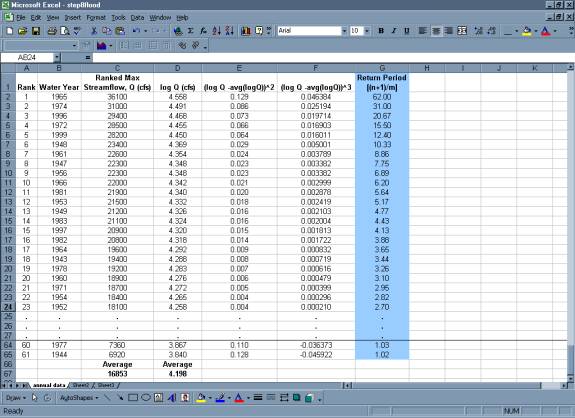
Step 8: Create a column
with the return
period (Tr) for each discharge using Excel formula {(n+1)/m}.Where
n = the number of values in the dataset and m = the rank.
Step 9: Complete the table
with a final column showing the exceedence probability of
each discharge using the excel formula {=1/Return Period or 1/Tr} and the
copy command.
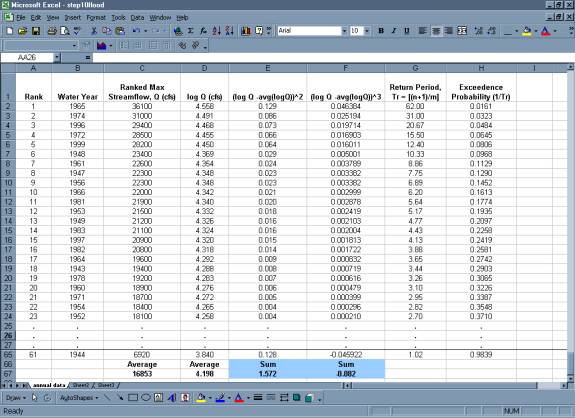
Step 10: Calculate the
Sum for the {(logQ avg(logQ))^2} and the {(logQ avg(logQ))^3} columns.
variance =
standard deviation =

skew coefficient =
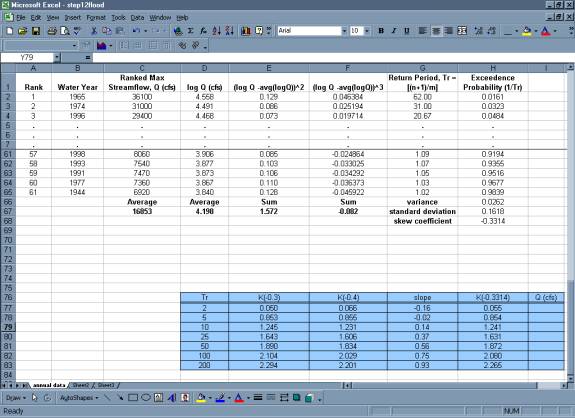
Step 12: Calculate k values
- Use the frequency factor table and the skew
coefficient to find the k values for the 2,5,10,25,50,100, and 200 recurrence interval
- If
the skew coefficient is between two given skew coefficients in the table
than you can linearly extrapolate between the two numbers to get the appropriate
k value. To view the frequency factor table
click on the button below.
Step 13: Using the general
equation, list the discharges associated with each recurrence interval

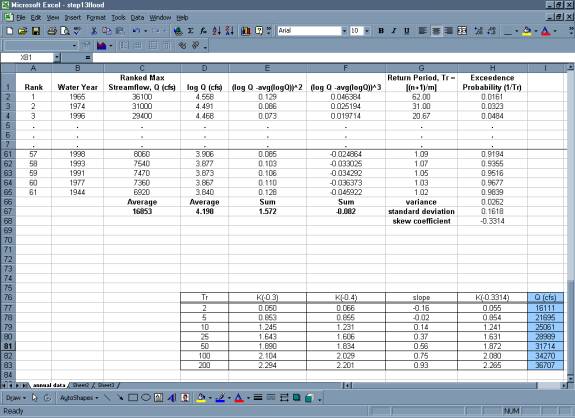
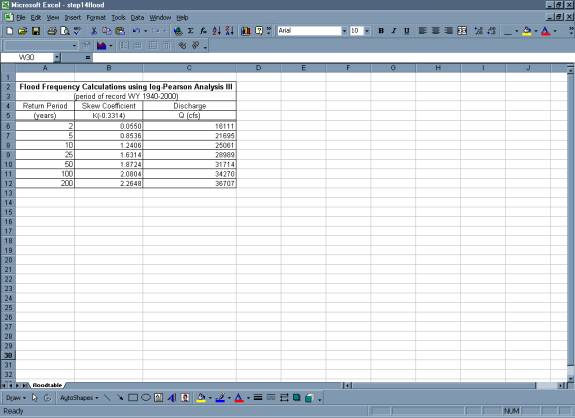
Step 14: Create table of Discharge values
found using the log Pearson analysis
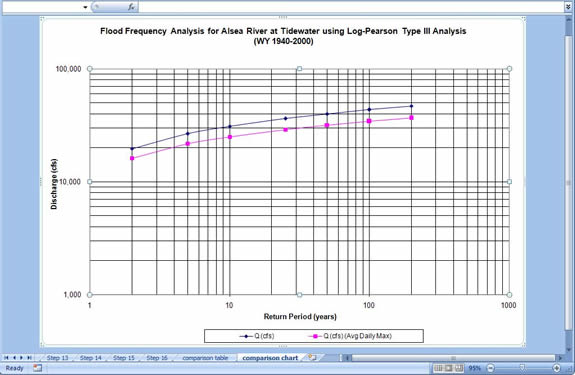
Step 15: Create Plot
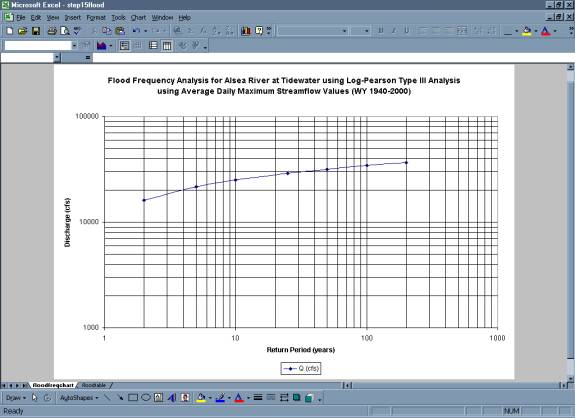
- Below is a comparison of flood frequency analysis completed
using mean daily data versus instantaneous discharge data. As can be seen,
had you completed this analysis using instantaneous peak discharge data,
the result would have been a more conservative estimation of the discharges
associated with each return period.
|