Tips for Data Manipulation: Example
|
Information to get started:
- The lesson below contains step-by-step instructions and "snapshots" of what each step
looks like when carried out in a Microsoft Excel workbook. Blue shading of information
in the Excel illustrations denotes changes made from the previous step. Dots placed in
three consecutive rows indicate that a portion of data is hidden from sight.
- You can download an Excel workbook containing the complete data set by clicking on the
"Download Data" link below. It contains
each calculation step on a separate worksheet. To move between steps, click on the
tabs at the bottom of the excel window.
- When you download the file, it may open in your browser window. You may wish to use the
"save as" function to save the file to a local drive and then reopen it in Excel. This
will make it easier to flip between the online lesson and the example workbook.
- Finally, we want to remind you that the techniques explained on this site are statistically
based; therefore results must be viewed as predictions and not as facts. Please use
the techniques and the information obtained from them responsibly!
|
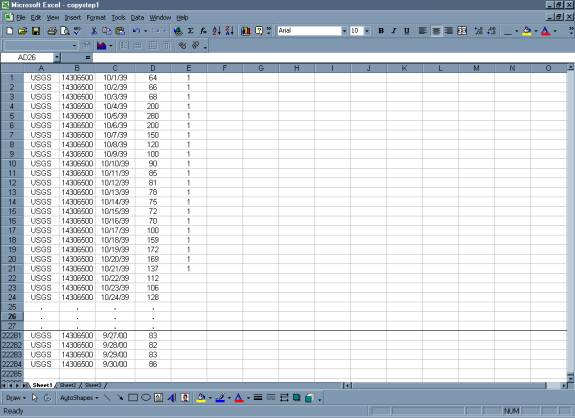
Step 1: Copy Daily Streamflow Data from USGS web site into
Excel Spreadsheet
- Go
to http://oregon.usgs.gov
- On the left sidebar, under Historical Data, select Streamflow
- Select Daily Data
- Check
box under Site Identifier for Site Name and Submit
- Type
in Alsea under Site Name and select match any part and Submit
- Select
gage at TIDEWATER (14306500)
- Select
Tab-separated data and Display in browser and Submit
- Select
the entire data set to copy
- Paste
Special as text (this will separate the data into columns)
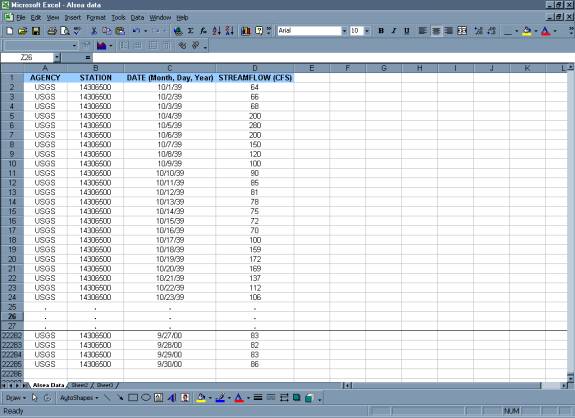
Step 2: Organize spreadsheet with data
- Eliminate
extraneous data (i.e., column E)
- Add
titles to remaining Four columns
- NOTE: Data are listed in water years, hence 10/1/1939 9/30/40
is Water Year 1940.
- Label
Sheet
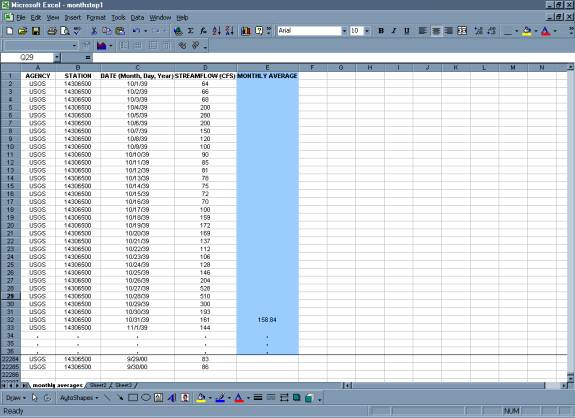
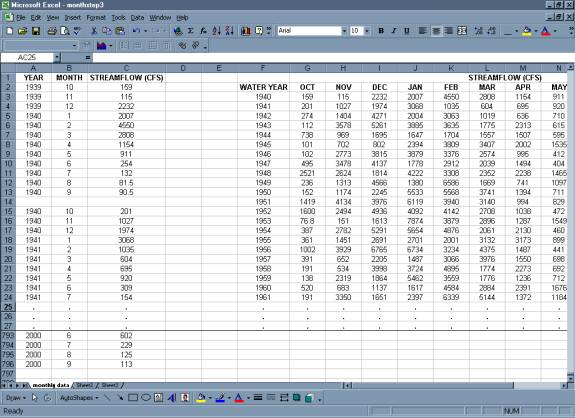
Step 3: Obtain Monthly Averages
MANUALLY
- In
fifth column, use the average function in Excel to obtain the average for each
month for the first four years.
- Copy
the monthly average column for the first four years and paste to rest of
data set. This will compute the monthly averages for the remaining years.
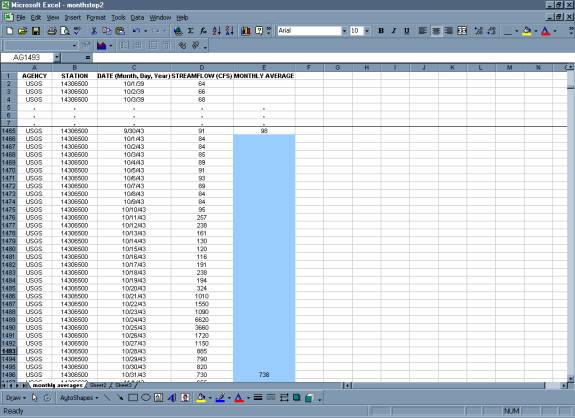
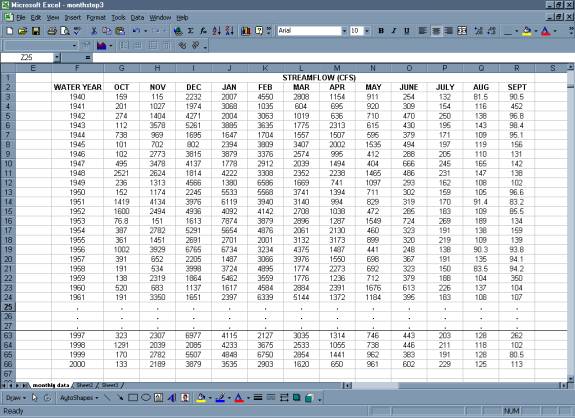
- Organize
Monthly Data by Year

IF USING A USGS GAGE, MONTHLY STATISTICS ARE ALREADY CALCULATED
- Go
to http://oregon.usgs.gov
- Select
Historical Water Data
- Select
Surface Water
- Select
Statistics (Monthly)
- Check
box under Site Identifier for Site Name and Submit
- Type
in Alsea under Site Name and select match any part and Submit
- Select
Tab-separated data and Display in browser and Submit
- Select
gage at TIDEWATER (14306500)
** Data included in this table are for all of the Alsea gages,
be absolutely certain that you are using the data for your desired gage (in
this case 14306500)
- Select
data set for desired gage to copy
- Paste Special as text (this will separate
the data into columns)

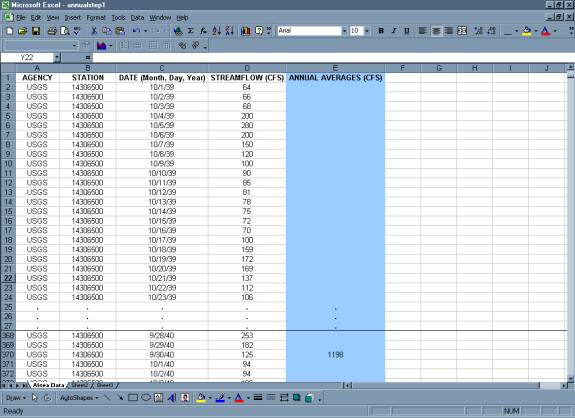
Step 4: Obtain Annual Averages
MANUALLY (Annual Averages are done based on Water Years 10/1/XX-9/30/XX)
- In
fifth column, use the average function in Excel to obtain the average for each
water year for the first four water years in the period of record.
- Copy
the annual average column for the first four years and paste to rest of
data set. This will compute the annual averages for the remaining years.
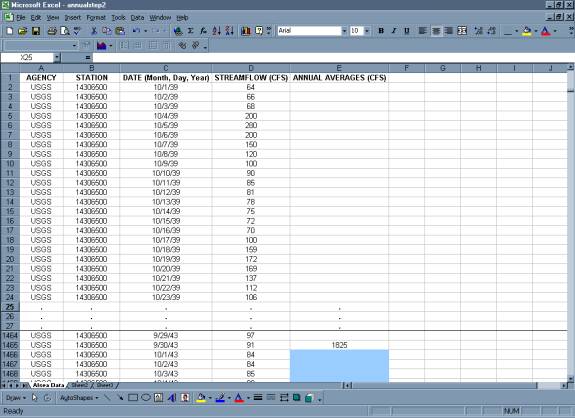
- Organize
Annual Data by Year for Period of Record
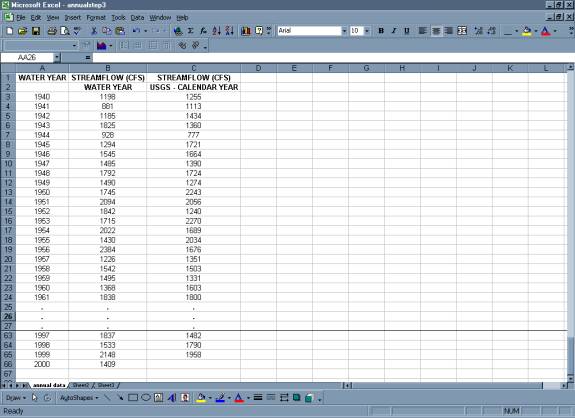
IF USING A USGS GAGE, ANNUAL STATISTICS ARE ALREADY CALCULATED
(Annual averages are based on calendar year 1/1/XX 12/31/XX)
- The monthly values can be used to generate mean annual flows
by water year.
- Go
to http://oregon.usgs.gov
- Select
Historical Water Data
- Select
Surface Water
- Select
Statistics (Annual)
- Check
box under Site Identifier for Site Name and Submit
- Type
in Alsea under Site Name and select match any part and Submit
- Select
Tab-separated data and Display in browser and Submit
- Select
gage at TIDEWATER (14306500)
** Data included in this table are for all of the Alsea gages,
be absolutely certain that you are using the data for your desired gage (in
this case 14306500)
- Select
data set for desired gage to copy
- Paste Special as text (this will separate the data into columns)

|